Geographic Data with GeoPandas
This tutorial extends the basic GeoPandas introduction to oceanographic datasets.
We’ll use Exclusive Economic Zones (EEZ) data from the Marine Regions project. The EEZ defines the sea zone over which a state has special rights regarding exploration and use of marine resources.
[1]:
import geopandas as gpd
import matplotlib.pyplot as plt
import cartopy.crs as ccrs
import cartopy.feature as cfeature
1. Loading EEZ Data
Download the EEZ shapefile from Marine Regions EEZ and IHO areas v5.
Make sure you unzip it, and replace the file path below with the location of the
.shp file.[2]:
# Load EEZ shapefile (update path to your local copy)
eez_path = "/Users/tgstone/data/SIO_software_carpentries/Intersect_EEZ_IHO_v5_20241010/Intersect_EEZ_IHO_v5_20241010.shp"  # Example path
eez = gpd.read_file(eez_path)

# Display data file
eez.head()
[2]:
| MRGID | MarRegion | MRGID_SOV1 | SOVEREIGN1 | UN_SOV1 | ISO_SOV1 | MRGID_SOV2 | SOVEREIGN2 | UN_SOV2 | ISO_SOV2 | ... | ISO_TER3 | EEZ_MRGID | EEZ | IHO_MRGID | IHO_Sea | AREA_KM2 | Latitude | Longitude | MRGID_comb | geometry | |
|---|---|---|---|---|---|---|---|---|---|---|---|---|---|---|---|---|---|---|---|---|---|
| 0 | 25614 | Albanian part of the Adriatic Sea | 2153 | Albania | 8 | ALB | 0 | None | 0 | None | ... | None | 5670 | Albanian Exclusive Economic Zone | 3314 | Adriatic Sea | 12127.0 | 40.93096 | 19.11030 | 3314_5670 | POLYGON ((19.9858 39.74337, 19.95858 39.7432, ... |
| 1 | 25622 | Albanian part of the Ionian Sea | 2153 | Albania | 8 | ALB | 0 | None | 0 | None | ... | None | 5670 | Albanian Exclusive Economic Zone | 3351 | Ionian Sea | 39.0 | 39.69394 | 19.97118 | 3351_5670 | POLYGON ((20.00835 39.69182, 20.0081 39.69187,... |
| 2 | 25603 | Algerian part of the Alboran Sea | 2152 | Algeria | 12 | DZA | 0 | None | 0 | None | ... | None | 8378 | Algerian Exclusive Economic Zone | 3324 | Alboran Sea | 7045.0 | 35.58150 | -1.74716 | 3324_8378 | POLYGON ((-1.18826 35.57788, -1.18973 35.5758,... |
| 3 | 25180 | Algerian part of the Mediterranean Sea - Weste... | 2152 | Algeria | 12 | DZA | 0 | None | 0 | None | ... | None | 8378 | Algerian Exclusive Economic Zone | 4279 | Mediterranean Sea - Western Basin | 124141.0 | 37.29350 | 3.83338 | 4279_8378 | POLYGON ((7.81205 38.00998, 7.81355 38.00945, ... |
| 4 | 25525 | Angolan part of the South Atlantic Ocean | 2150 | Angola | 24 | AGO | 0 | None | 0 | None | ... | None | 8478 | Angolan Exclusive Economic Zone | 1914 | South Atlantic Ocean | 495860.0 | -11.70110 | 11.03537 | 1914_8478 | MULTIPOLYGON (((13.42086 -5.8734, 13.39728 -5.... |
5 rows × 35 columns
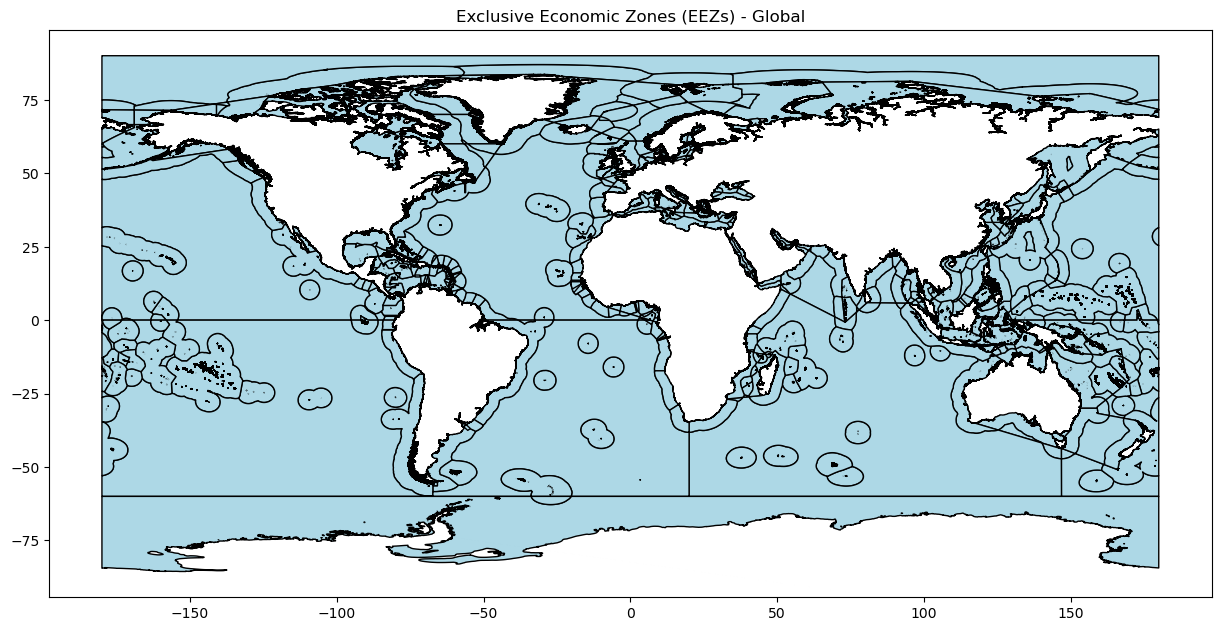
2. Plotting EEZ Boundaries
We can visualize all EEZ boundaries in the world.
[3]:
# Basic plot of EEZ polygons
eez.plot(figsize=(15, 10), color="lightblue", edgecolor="black")
plt.title("Exclusive Economic Zones (EEZs) - Global")
plt.show()
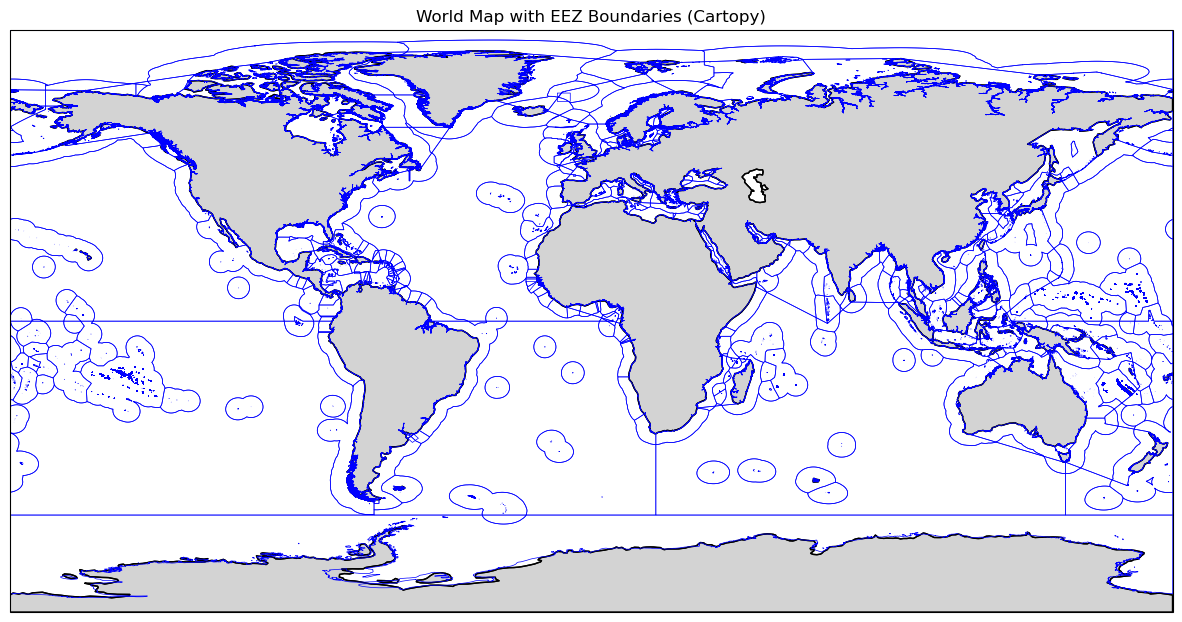
3. Overlay EEZ with Land Boundaries
Let’s overlay EEZ boundaries with a world basemap from GeoPandas’ built-in dataset.
[4]:
fig, ax = plt.subplots(figsize=(15, 10), subplot_kw={'projection': ccrs.PlateCarree()})

# Add land feature for world basemap
ax.add_feature(cfeature.LAND, facecolor='lightgray', edgecolor='black')
ax.coastlines()

# Plot EEZ boundaries using GeoPandas with Cartopy axes
eez.boundary.plot(ax=ax, color="blue", linewidth=0.5, transform=ccrs.PlateCarree())

plt.title("World Map with EEZ Boundaries (Cartopy)")
plt.show()
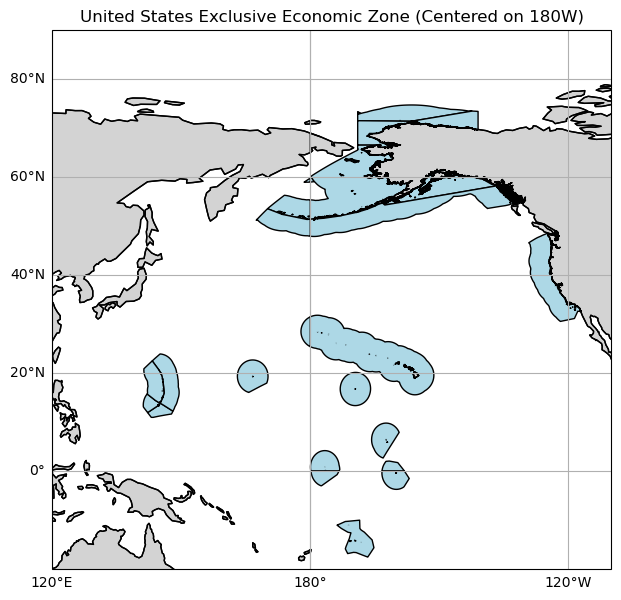
4. Filtering EEZ for a Specific Country
We can filter the EEZ dataset by the SOVEREIGN1 field to show only one country’s EEZ.
[5]:
usa_eez = eez[eez["SOVEREIGN1"] == "United States"]

fig, ax = plt.subplots(figsize=(15, 7), subplot_kw={'projection': ccrs.PlateCarree(central_longitude=180)})

# Add land feature for world basemap
ax.add_feature(cfeature.LAND, facecolor='lightgray', edgecolor='black')
ax.coastlines()

# Add longitude and latitude gridlines
gl = ax.gridlines(draw_labels=True, dms=True, x_inline=False, y_inline=False)
gl.top_labels = False
gl.right_labels = False

# Center the map on 180W (central_longitude=180) and set a reasonable extent
ax.set_extent([120, 250, -20, 90], crs=ccrs.PlateCarree())

# Plot United States EEZ polygons using GeoPandas with Cartopy axes
usa_eez.plot(ax=ax, color="lightblue", edgecolor="black", transform=ccrs.PlateCarree())

plt.title("United States Exclusive Economic Zone (Centered on 180W)")
plt.show()